DevelopNow Reports
DevelopNow > DevelopNow Reports
Description
As an admin of DevelopNow I am able to generate reports to monitor several CPD statistics, so that I am able to analyse the data and see which areas of the CPD process need attention.
Applicable User Roles
List of roles that have access or can use this feature.
CPD Admin
How To
To access the reporting feature, a user with the CPD Admin role can access the page by clicking on the Reporting icon in the Navigation bar whilst in DevelopNow.
The graphs are created alongside client requirements, ensuring that the data provided is beneficial and relevant. If you wish to make a request for a new report to include in future releases, please contact us at features@skillsnow.com.
Once you have generated a report, there are several options available to customise is to your needs or to export the data in a range of formats.
Chart Options
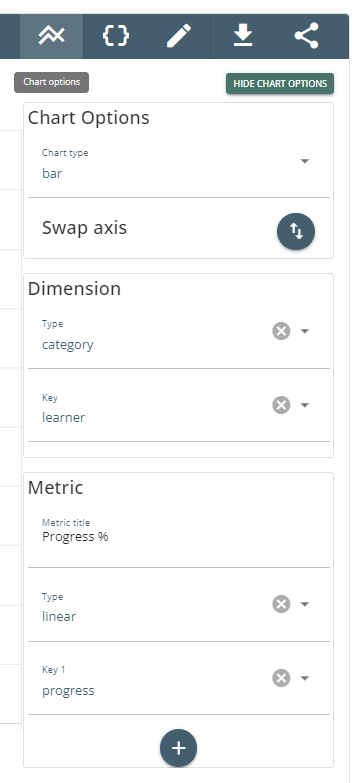
Clicking this button will open a menu to let you change several options about how the generated graph is displayed.
- Chart Type
Gives you the option of selecting between a line and a bar graph.
- Swap Axis
Swaps the current x-axis with the y-axis.
- Dimension - Type
Lets you choose the data type displayed on the x-axis. Can select between Linear, Time and Category.
- Dimension - Key
Lets you choose the attribute you wish to display on the x-axis.
- Metric - Title
Inserts a title onto the y-axis.
- Metric - Type
Lets you choose the data type displayed on the y-axis. Can select between Linear, Time and Category.
- Metric - Key #
Lets you select the data set. If more than one data set is available, you can click on the + button to display multiple datasets on the same report.
View Query

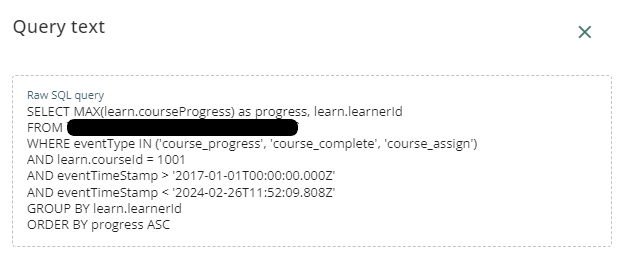
Opens a popup and displays the raw SQL query used to create the report. Can copied and inserted into the Custom query option, which then allows for modifications to be made to suit any particular requirements.
Edit Report

Opens a pop-up that allows you to modify any of the options that you selected before you generated the report.
Export Data


Export data allows you to export either the graph as an image, or the data as a .csv or .json file. Ths allows you to present the data easily outside of the platform, or import it into an external data analysis tool.
Share Report

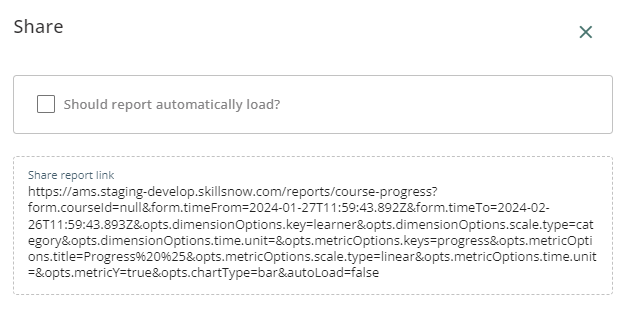
The Share Report button opens up a dialog with a URL which can be shared with others. Please note that the URL directs the individual to view the report on the platform, so the individual must have a SkillsNow account and a role with the correct permissions to view the report.
If you wish to share the report with users who do not have access to SkillsNow, use the Export data funtion instead.
Reports
Course Progress
This report allows you to see all individuals % Progress for a particular course, across a particular time period.
You have the option to select the Course you wish to view progress across and the time range in which course progress is made.
Begin entering a course name into the Course field to view a list of matching courses.
Quarterly Team Score Report
This report will show the average Progress scores of all the members of a particular team per quarter.
You have the option to select the team and the time range you in which the scores were recorded. One or more teams can be selected.
Begin entering a team name into the Team field to view a list of matching teams.
Quarterly User Score Report
This report will show the Progress scores of one or more individuals per quarter.
You have the option to select the individual and the time range you in which the scores were recorded.
Begin entering a users name into the User field to view a list of matching teams.
Team Training Path Progress
This report will show the average training path % progress of the all the members of a team over time.
You have the option to select the team and the time range you in which the progress was recorded. One or more teams can be selected.
Begin entering a search term into each of the fields to view a list of matching terms.
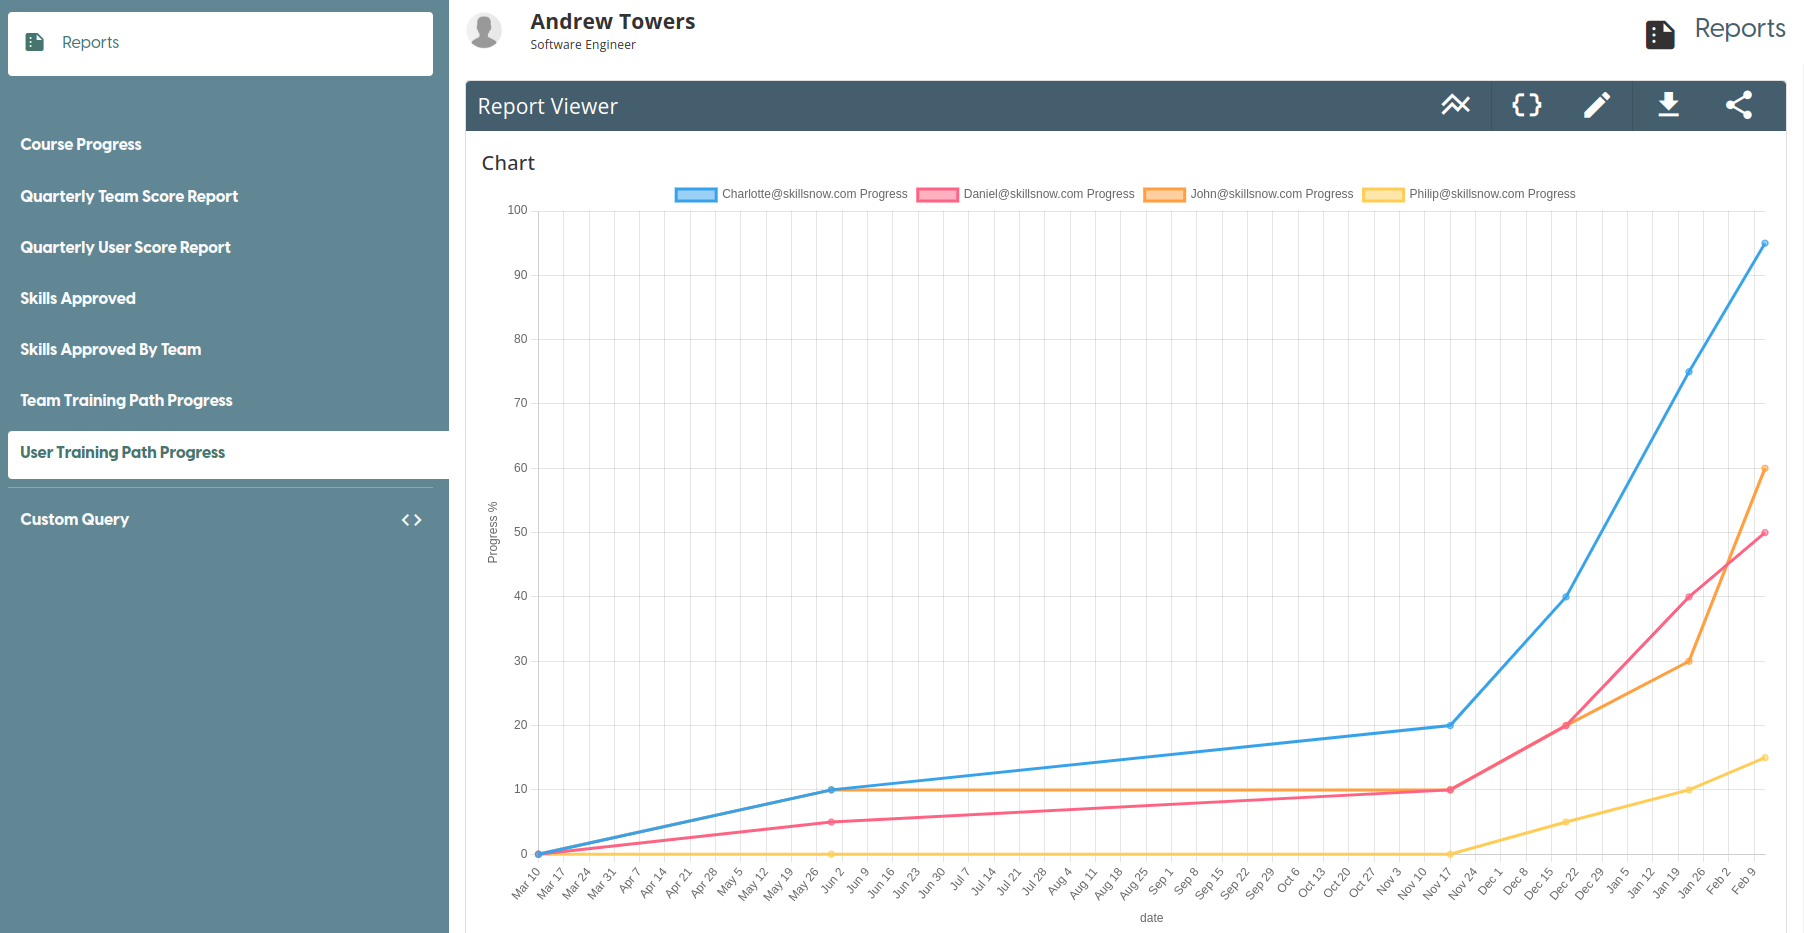
User Training Path Progress
This report will show the average training path % progress of one or more individuals over time.
You have the option to select the users and the time range you in which the progress was recorded. One or more users can be selected.
Begin entering a search term into each of the fields to view a list of matching terms.